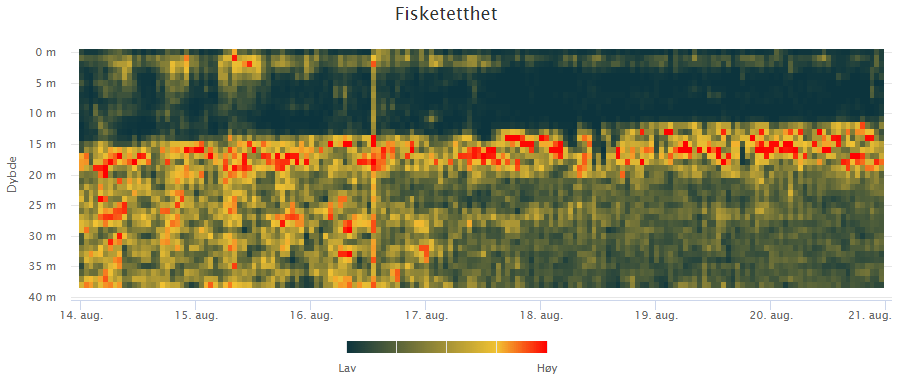
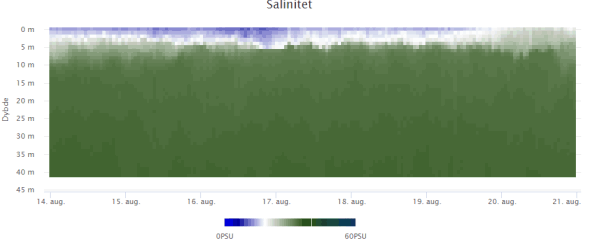
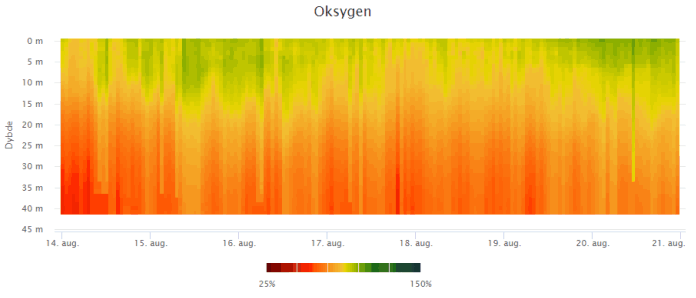
Conditions vary significantly. They can be fantastic at the surface and horrible at the bottom. Days later it can be the other way around. Full profile information is essential for understanding a dynamic cage.
Echosounder data is used to map the fish distribution in the cage. Combined with environment data profiles, this shows what the fish are experiencing in the cage. Conditions from the fish's perspective.
There are layers in the cage. These layers are important, but not immediately visible, unless you 'slice the layer cake'. The graphic shows the boundary layer between salt and brackish water called the halocline and is particularly important for sea lice. Profile data makes the layers visible.
Many datatypes being recorded by the same equipment and at the same time and place makes a dataset readily available for extracting deeper insights.
Long time series enable deeper analysis with long term predictions. The graphic is from a report on growth increase of a considered new cage technology. The accuracy and value of the analysis increases with the length of the available time series.
Shown here is an illustrated Digital twin of the cage. Using data in models for simulations and visualization give comletly new operational tools. A wide range of insights are possible with real profile data.
Free AI Website Maker